
Chapter 8: Measuring What Matters: Metrics for Founders and Small Teams
You just had your best week. Eighty outreach messages sent, six responses, two discovery calls booked. You close your laptop feeling productive. But was it a good week?
Without the right metrics, you can't answer that. Maybe those six responses came from prospects who'll never buy. Maybe your two calls were tire-kickers while three serious buyers got lost in your follow-up. Maybe you're counting activity that isn't leading anywhere.
You can go wrong in two directions: tracking nothing leaves you flying blind (you can't tell which channels produce the best customers or where your process breaks), while tracking everything leads to analysis paralysis: hours spent updating dashboards nobody reviews while you avoid doing the work.
The answer is a short list: four numbers while you're pre-revenue, growing to five to seven core numbers once you have customers, reviewed every week.
This chapter covers the handful of numbers that show whether your acquisition system is healthy, where to improve, and when something's broken. They are chosen for a founder or small team with limited time; enterprise analytics built for 50-person teams and vanity metrics built for VC decks are left out. (When you make your first GTM hire, these metrics become the shared playbook they co-own.)
Founder-Type Note: The core metrics (LTV:CAC, churn, conversion rates) apply to all business models, but how you calculate them differs. B2B SaaS founders track recurring revenue and subscription churn; coaches and creators track repeat purchases, upsells, and referral rates.
The Only Three Questions Your Metrics Need to Answer
Every useful metric answers one of three questions:
Question 1: Is my acquisition working? Are people responding, booking calls, buying? Is the top of the funnel producing opportunities, and are they converting to revenue?
Question 2: Am I building a sustainable business? Are customers staying? Are they profitable? Am I spending more to acquire them than they're worth?
Question 3: Where is my process broken? Where are prospects dropping out? Which stage has the biggest gap between possible and actual?
If a metric doesn't answer one of these, you probably don't need to track it.
The Core Acquisition Metrics
Response Rate Benchmarks:
| Outreach Type | Typical Reply Rate | Notes |
|---|---|---|
| Cold email, all campaigns | 0.45% of emails sent | Belkins, 7.5M emails in 2025 [1] |
| Cold email to founders and owners | 0.57% | Highest of any seniority level [1] |
| Cold email to companies with 0-10 employees | 0.72% | Over 3x the rate at 10,000+ employees [1] |
| Highly personalized outreach | Above baseline | Varies by market and message |
Use these as starting points, not targets. Belkins divides replies by emails sent; older benchmarks that divided by emails opened look several times higher, so check the denominator before comparing. Your own baseline matters more than any industry average.
Response Rate. For outbound (cold email, LinkedIn, DMs), this is your primary signal: whether your messaging resonates and you're reaching the right people. Divide responses by attempts. Cold email typically draws well under 1% replies per email sent; a rate well below your own baseline points to targeting, deliverability, or messaging [1]. On LinkedIn, warm up first and lead with context rather than a pitch.
Case Study (composite, segment analysis): A founder selling analytics software ran warm LinkedIn outreach to both marketing directors and CTOs, split evenly. After three months, directors showed a 12% response rate, an 8% meeting rate (meetings per message sent), and a $2,400 average deal; CTOs showed 3%, 1%, and $3,200. Per 100 messages, directors produced about six times the pipeline value, so he shifted 80% of outreach to directors. Monthly revenue rose about 40% on the same volume.
Meetings Booked. Response rate alone doesn't tell you if responses convert. Track meetings as an absolute number and as a rate from responses: 50 responses and 10 meetings is 20%. High response with low booking usually means an interesting initial message but a weak follow-up, or curious-but-unqualified respondents.
Pipeline Value. The total value of all active opportunities (10 deals at $2,000 is $20,000), of which 20-30% typically converts. If it's less than 3x your revenue target, you probably won't hit your number; healthy founder-led B2B pipeline is 3-5x target.
Win Rate. Closed deals divided by total opportunities: 20 discovery calls and 5 closes is 25%. This is where many founders fool themselves: they count everyone who expressed interest as an "opportunity," then wonder why their win rate is 5%. A true opportunity has had a real buying conversation.
Win rates vary widely by industry, channel, deal size, and how you define an opportunity; Livespace's data from more than 1,200 small and midsize businesses shows large differences by industry [2]. Prioritize your own baseline and trend. Benchmarks need volume: under 20 qualified conversations, win rate swings wildly, so until you reach 30-50 opportunities, focus on volume rather than rate.
Below 15% with real volume, you're qualifying poorly (letting unqualified prospects in) or presenting poorly (failing to convert qualified ones). Figure out which.
Sales Cycle Length. Time from first contact to closed deal; it matters for forecasting and spotting stuck deals. Track the average and distribution; widely mixed lengths (7 days versus 90) indicate different customer types.
Sales Cycle Length Benchmarks:
| Deal Size (ACV) | Typical Sales Cycle | Notes |
|---|---|---|
| SMB (under $15,000) | 14-30 days | Common rule of thumb |
| Founder sub-$5K | 14-30 days | Typical for small deals |
| Mid-Market ($15,000-$100,000) | 30-90 days | Common rule of thumb |
| Enterprise (over $100,000) | 90-180+ days | Common rule of thumb |
Warning: Sub-$5K deals taking over 45 days signal process friction.
The Sustainability Metrics
Note for early-stage founders: These require customers. If you're pre-revenue or have fewer than 20 customers, they won't be meaningful yet. Focus on the acquisition metrics above and come back once you have 3-6 months of data.
These indicate whether purchases build a lasting business. The most common LTV:CAC benchmark is 3:1 [3], and in SaaS Capital's 2025 survey the median private SaaS company kept 91% of its revenue year over year before upsells (gross revenue retention) [4].
Customer Acquisition Cost (CAC). Total spend to acquire a customer, including tools, ads, your time, and contractors. Spending $500 a month to win 5 customers is a $100 CAC, a number that means something only relative to LTV.
CAC Benchmarks by Industry:
| Industry | Average CAC | Notes |
|---|---|---|
| B2B SaaS | $239 | $205 organic, $341 paid [5] |
| Fintech SaaS | ~$1,450 | Regulatory complexity, longer cycles [5] |
These come from an SEO agency's client data (January 2022-August 2025), so organic acquisition is overrepresented. Track your own CAC by channel to find the most efficient acquisition paths.
Lifetime Value (LTV). Total revenue expected from a customer. For subscriptions, it's monthly revenue × lifespan in months; for one-time sales, it's the purchase price plus repeat purchases and upsells. Example: a $500 product where 20% of buyers add a $1K follow-up gives an LTV of about $700.
LTV:CAC Ratio
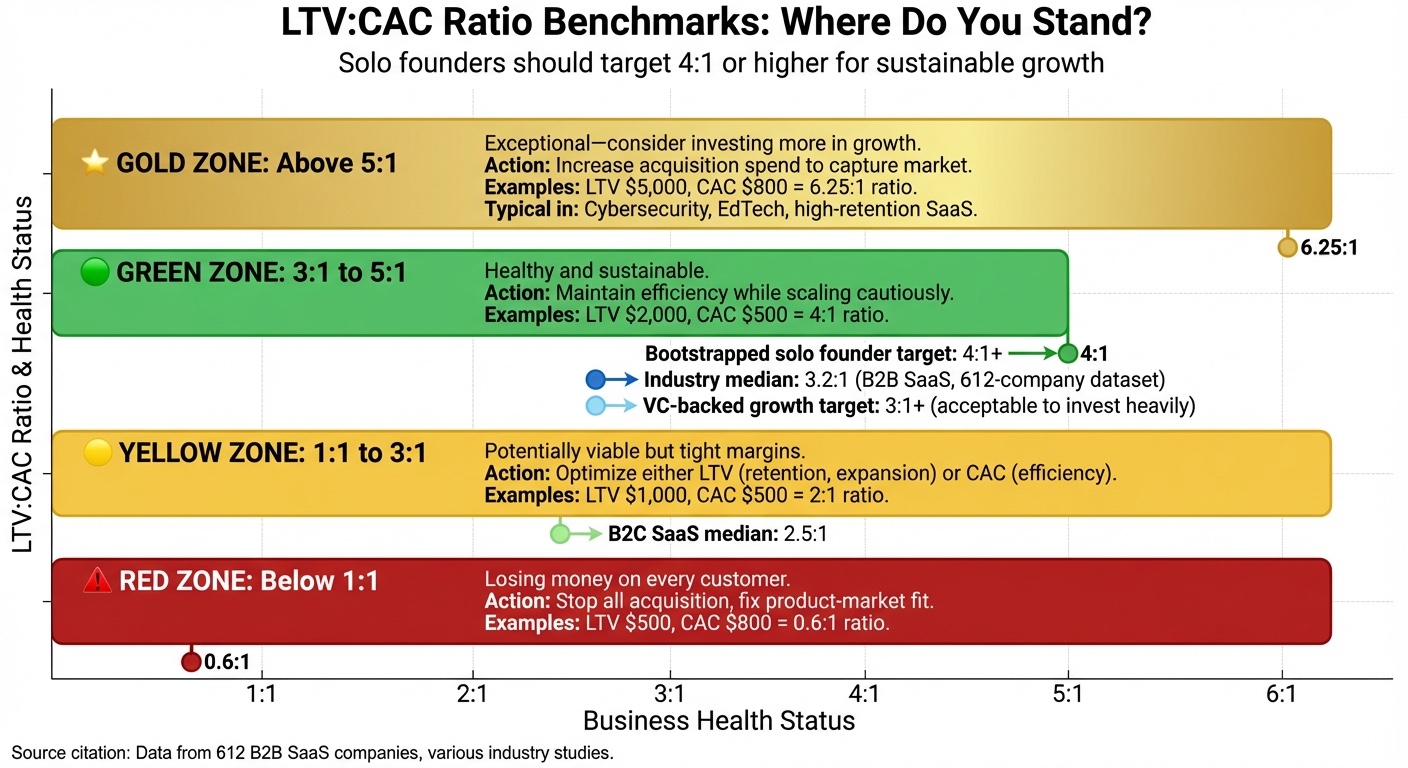
Figure 8.1: LTV:CAC Ratio Benchmarks. The metric that tells you whether your business model works. Below 1:1 means you're losing money on every customer. 1:1 to 3:1 is tight margins but potentially viable. 3:1 or higher is healthy and sustainable. 3:1 is the most common benchmark.
Divide LTV by CAC. The ratio tells you whether your business model works: $700 LTV ÷ $100 CAC = 7:1 (excellent).
| Ratio | Status | Notes |
|---|---|---|
| 5:1+ | Excellent | Room to invest more in growth |
| 3:1-5:1 | Healthy | 3:1 is the most common benchmark [3] |
| 1:1-3:1 | Tight margins | Viable but risky |
| Below 1:1 | Unsustainable | Losing money per customer |
Case Study (composite, LTV:CAC in action): A B2B SaaS founder comparing organic content, paid ads, and referrals ran the numbers after 12 months: LTV $2,400 ($200/mo × 12); organic CAC $300 once his writing time was counted (8:1); paid CAC $450 (5.3:1); referral CAC $50 for a thank-you credit, with referred customers staying 18 months (LTV $3,600, 72:1). Every channel cleared 5:1, but referrals and organic returned far more per dollar, so he put his next hours there and kept paid ads as a small test.
Churn Rate. For subscriptions, the percentage of customers who leave in a period: start with 100, lose five, monthly churn is 5%. The math compounds: 5% monthly loses 46% annually; 2% loses 22%. At the higher rate, much of your new sales effort goes to replacing customers you lost.
There's no single "good" rate. It depends on your model: enterprise contracts churn least (the drivers are stakeholder changes and acquisitions), small-business customers churn more (price sensitivity, small-client failure), and freemium or usage-based products churn most (low commitment, "tourist" users). SaaS Capital's data shows the same slope by price: products with higher contract values keep more of their revenue [4].
For SMB customers, monthly churn below 3% is healthy and below 5% acceptable; above 5%, fixing it is the top priority, because you can't grow faster than you're losing. Revenue churn matters far more than logo churn: losing 10 customers on a $10/month plan hurts less than losing one on a $500/month plan.
Net Revenue Retention (NRR). Accounts for both churn and expansion: of the customers you had 12 months ago, how much are they paying today? A cohort that paid $10,000 and now pays $11,000 (minus churned, plus upsells) is 110%. Above 100% means you grow even without acquiring new customers. In SaaS Capital's 2025 survey, median NRR was 101% overall and 104% for bootstrapped companies [4]. For a bootstrapped founder, around 100% is healthy, well above it exceptional, and below 90% a problem.
CAC Payback Period. How long until a customer's revenue recovers your acquisition cost: CAC $500 at $100/month is 5 months.
| Business Model | Target Payback | Notes |
|---|---|---|
| B2B SaaS (Bootstrapped) | 4-6 months | Sustainable cash flow |
| B2B SaaS (VC-backed) | 6-12 months | Funding affords longer payback |
| SMB SaaS | 3-6 months | Lower ACV, faster payback |
| Mid-Market SaaS | 12-24 months | Higher ACV, longer payback |
| Enterprise SaaS | 18-30+ months | Very high ACV, longer cycles |
Faster payback means better cash flow; payback and LTV:CAC together tell the full story. Bootstrapped target: recover CAC within 6 months.
The Diagnostic Metrics
Stage Conversion Rates. Track how many prospects move from each stage to the next; that's where most problems hide.
| Stage | Conversion Rate | Notes |
|---|---|---|
| Lead → MQL | 39% | B2B SaaS benchmark [6] |
| MQL → SQL | 38% | B2B SaaS benchmark [6] |
| SQL → Opportunity | 42% | B2B SaaS benchmark [6] |
| Opportunity → Closed Won | 37% | B2B SaaS benchmark [6] |
| Response → Meeting | 20% | Typical (50 responses → 10 meetings) |
| Meeting → Qualified | 60-70% | With proper MVQ qualification |
| Qualified → Closed | 15-40% | Varies by channel |
Each stage diagnoses something: low response-to-meeting means messaging or follow-up isn't landing; low meeting-to-qualified means you're reaching the wrong people; low qualified-to-closed means pricing, presentation, or timing is off. Watch week-over-week drops, but separate real problems from data-quality or timing noise.
Channel Performance. Track by source (cold email, LinkedIn, content/inbound, referrals, partnerships), recording leads, meetings, deals closed, revenue, and time invested for each. Usually one or two channels significantly outperform; invest there and trim the rest.
AI search is an emerging channel. As buyers research vendors inside ChatGPT, Perplexity, and AI Overviews, raw traffic understates it. Measure AI-visibility signals instead (share-of-answer, AI-shortlist mentions, citations, assisted pipeline from AI sources); Semrush estimated that the average visitor from AI search is worth 4.4 times an organic search visitor, based on conversion rate, in a 2025 study of marketing and SEO topics [7].
Case Study (composite, channel mix): A founder splitting time across cold email and referrals calculated revenue per hour: referrals 3x cold email, with cold email still feeding referral sources. He shifted prospecting toward referrals while keeping cold email for pipeline; overall yield improved.
Time in Stage. How long deals sit before they move to the next stage (or die). Watch outliers: a deal 45 days in "Proposal Sent" is dead, so mark it; one 3 weeks in "Discovery" needs a push. Healthy founder times: Discovery 1-2 weeks, Proposal 1-2 weeks, Negotiation up to 1 week, total 2-5 weeks, with sub-$5K deals usually closing in 14-30 days. Any stage over 3 weeks means deals are stalling.
What Not to Measure
Some numbers aren't worth tracking:
Metrics without context. Website visitors, social followers, email list size: useful only paired with outcomes. A founder with 100 subscribers converting at 10% gets the same 10 customers as one with 10,000 converting at 0.1%; the bigger list only looks better. Pair top-of-funnel metrics with bottom-of-funnel results.
Metrics you can't act on. If a number won't change your behavior, skip it. Open rates are an example: if they drop, you'd take the same action you'd take for a drop in response rate. Response rates are actionable; open rates are noise.
Lagging indicators without leading ones. Revenue is lagging: by the time you see it, the work happened weeks ago. Track leading indicators you can influence today (outreach, response rates, meetings); use lagging ones (revenue, churn) to validate them.
Metrics that cost more to track than to improve. If you spend an hour updating a dashboard and ten minutes analyzing it, something's wrong. Overhead should be trivial next to the insight.
Building Your Dashboard
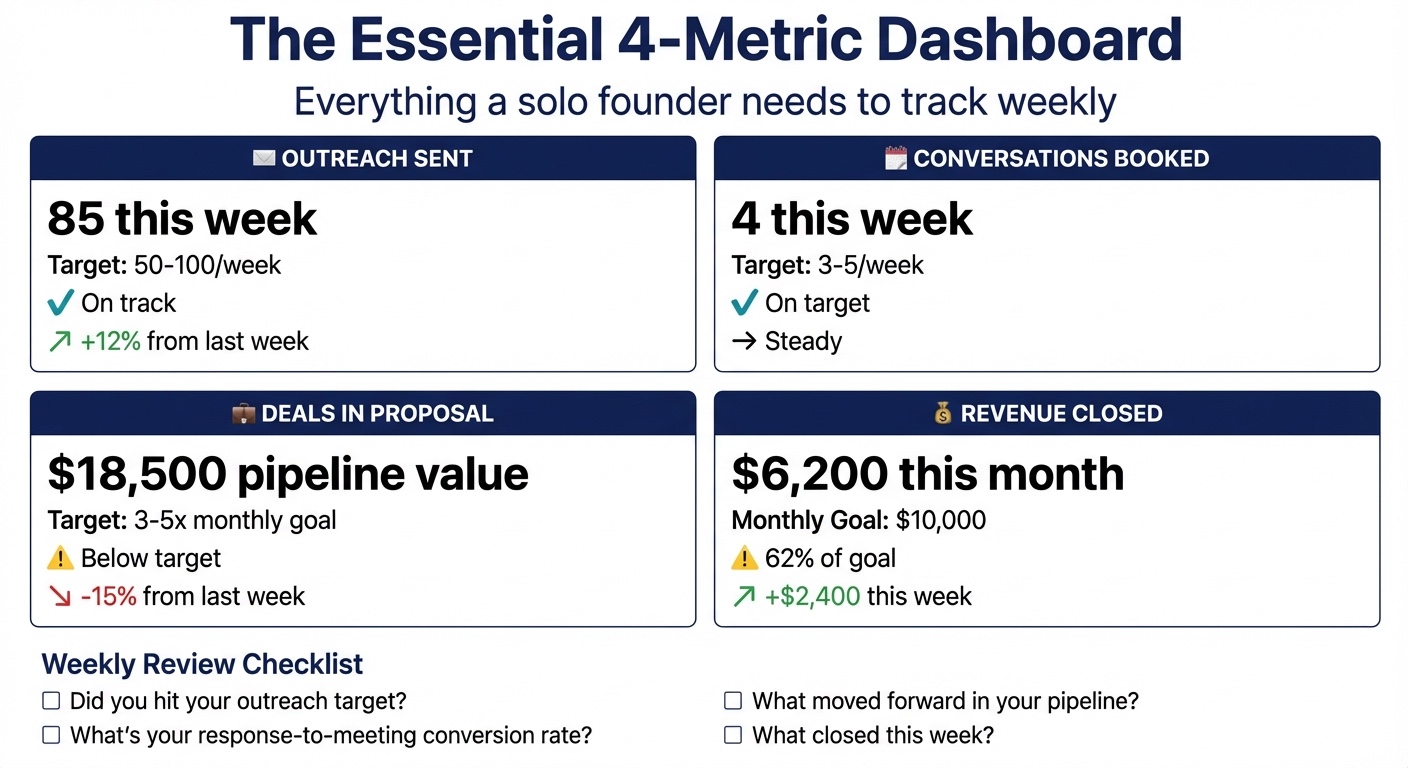
Figure 8.2: The Essential 4-Metric Dashboard. These four metrics tell you everything you need to know when you're starting out: outreach sent, conversations booked, deals in proposal stage, and revenue closed. Update them weekly in a simple spreadsheet. If these four metrics are healthy, your acquisition system is working.
If you're pre-revenue, these are the only metrics that matter:
- Outreach sent: Personalized messages (Target: 25-50/week while you're learning, the 5-10 a day that fits a 30-minute block; 50-100/week once messaging is proven)
- Conversations booked: Discovery calls scheduled (Target: 1-3/week from 100 well-targeted messages; more if outreach is warm or referral-led)
- Deals in proposal stage: Qualified opportunities active (Target: 3-5x monthly revenue goal)
- Revenue closed: What closed this week/month (track against goal)
Four numbers, updated weekly. Review cadence beats tooling: a 15-minute weekly review in Google Sheets beats an elaborate dashboard you check once a month. Pick something simple enough that you'll use it.
When You're Ready for More
Add complexity only with consistent data and a clear need. The sustainability metrics (CAC, LTV, LTV:CAC, NRR) and diagnostic metrics (sales cycle, time in stage, channel attribution) become relevant once you have 20+ customers and a few months of data.
Tracking Across Multiple Tools
You don't need a data warehouse. A minimal stack works: CRM for deals and pipeline stages, payment processor (Stripe, PayPal, or accounting tool) for revenue, and a spreadsheet where you calculate LTV, CAC, churn, and NRR from weekly/monthly exports. Many modern CRMs (HubSpot, Attio, Close) integrate with Stripe, Calendly, and email tools, so some of the stitching becomes automatic as you scale. Once you have 20+ customers, calculate CAC and LTV by acquisition channel, which is where big allocation decisions come from; you may find referrals have 3x the LTV of cold email at half the CAC.
For SaaS/app founders: With user logins, lightweight product analytics (PostHog, Mixpanel) enable usage-based churn prediction. They're optional; add them when you feel the pain.
Self-Hosted Analytics (Optional, Advanced)
A technical founder on a VPS stack (Chapter 7) can pull SaaS-tool data into a central Postgres via ETL/automation (n8n or Trigger.dev), with a lightweight BI tool (Metabase, Lightdash, or Grafana) for dashboards: one place to calculate LTV, CAC, churn, and NRR with no vendor lock-in. When to move: under ~50 customers and a few thousand in MRR, a spreadsheet plus exports gives 90% of the insight for 10% of the effort. Move only when manual exports start hurting.
The "One Metric That Matters" Framework
Growth marketer Sean Ellis is often credited with the idea of a "North Star metric": one number that aligns everyone around a single growth goal. Lean Analytics calls the stage-specific version the One Metric That Matters (OMTM) [8]. The OMTM is the single number that best reflects your business's health at this stage, and it changes as you grow.
- Pre-product-market fit: Conversations. Are you talking to and learning from potential customers?
- Early sales: Win rate. When you talk to qualified prospects, are they buying?
- Growth stage: Pipeline velocity. Is acquisition producing enough qualified opportunities?
- Scaling: LTV:CAC ratio. Is growth sustainable and profitable?
- Retention focus: NRR. Are existing customers a foundation for growth?
Pick one, make it visible, and let it guide where you spend your time.
Case Study (composite, OMTM: discovery calls booked): A B2B SaaS founder set OMTM = "discovery calls booked" for 90 days, refining ICP, then personalization, then A/B tests. Result: the share of warm, personalized messages that turned into booked calls rose from 4% to 18%; 66 calls, 19 customers (29% close), $47,500.
Forecasting: Predicting Revenue Without a Crystal Ball
Forecasting as a founder is hard: too few deals for statistical models, pipeline swings too large for trend analysis. Two simple approaches:
The Binary Method. For each active deal, make a forced choice: Commit (you'd bet your own money it closes this month: confirmed intent, budget, no known blockers) or Upside (everything else). Your forecast = sum of Commits. With about 10 deals, variance is too high for probability weighting, so the binary method is more accurate.
The Pipeline Coverage Test. Is your pipeline large enough to hit target? Want $10,000 this month at a 25% win rate? You need $40,000 in pipeline (proposal stage or later); with $20,000 you probably won't, even if everything goes well. (If you're pre-revenue with few deals, focus on adding more; this math becomes useful at 5-10 active opportunities.)
When to Worry (and When Not To)
Some changes deserve concern and some don't:
- Worry when a metric trends wrong for 3+ weeks straight (one bad week is noise; three is a pattern); don't worry over normal weekly variation. Look at rolling averages, not single points.
- Worry when LTV:CAC is below 3:1 and you're trying to grow (spending more than you get back); don't when investing in channels that take time to mature (content, community). Track leading indicators of payoff while revenue catches up.
- Worry when win rate declines while pipeline grows (more opportunities, fewer conversions: a qualification problem); don't when win rate is high but volume is low. That's an acquisition problem, so generate more opportunities.
The Metric Review Rhythm
Detailed daily tracking burns you out, and monthly-only reviews let problems compound for weeks. A layered rhythm avoids both:
Daily (2 minutes): Glance at activity. Hit your outreach target? Anything to schedule? The goal is awareness: check that the machine is running.
Weekly (15 minutes): Pull your numbers. What moved? What stalled? Note concerns, but don't go down rabbit holes. Friday afternoon works, so you start Monday knowing where things stand.
Monthly (30 minutes): Zoom out on trends, channel health, and win-rate shifts, then decide where to invest and what to cut. Use AI as a pattern spotter: prompt it with your metrics and ask "What patterns? What should concern me?" It catches cross-metric shifts you'd miss, like response rate holding steady while response-to-meeting drops 15%.
Quarterly (1 hour): LTV:CAC, NRR, sales-cycle trends, forecast accuracy, allocation.
Learning From the Numbers
Look for the reasons behind the numbers. When response rates drop, find out why and fix it; tracking is only useful for what you learn and change. A dropped response rate means something changed (list, message, timing, market); a climbing win rate means you've gotten better at qualification, presentation, or selection. The skill is forming hypotheses about what numbers mean and testing them.
Case Study (composite, diagnosing a drop): A founder who noticed cold email response rates dropping tested three hypotheses: list quality, message staleness, and segment fatigue. Lists from a new source performed best: the old vendor had started including lower-quality data.
A Note on Enterprise Analytics
Enterprise sales analytics (dozens of metrics, attribution models, cohort analyses, Salesforce dashboards) doesn't scale down to founders and small teams. You lack the data volume for statistical significance, the team to maintain dashboards, and the budget. With 50 leads/month, you're often reading noise as signal. Track enough to learn, not so much that tracking becomes procrastination.
Chapter Summary: TL;DR
The core insight: Metrics are tools for decisions. Track 5-7 core metrics at most, focus on leading indicators you can influence, and review weekly. The OMTM approach prevents metric overload.
Key takeaways:
- Track five to seven core numbers you review every week, not everything you can measure
- Leading indicators (outreach, calls booked) predict results; lagging ones (revenue, churn) confirm them
- LTV:CAC ratio: 3:1 is the common benchmark; 5:1+ means room to invest more
- The median private SaaS company keeps 91% of revenue year over year before upsells; median NRR is 101% [4]
- Weekly reviews with daily glances: enough to catch issues, not so much that it becomes procrastination
- Minimal stack: CRM for deals, payment processor for revenue, spreadsheet for calculations
Next chapter: Chapter 9 covers handling obstacles: objections, rejections, and the psychology of selling.
The Exercise: Build Your Metrics System
Before moving on, set up the minimum viable metrics system for your business.
- Choose your tracking tool. A spreadsheet is fine; Notion, Airtable, or your CRM work too. Pick something simple you'll update.
- Define your pipeline stages. The steps from first contact to closed deal, with clear criteria for what moves a deal forward.
- Identify your OMTM. Based on your current stage, the one metric that matters most.
- Set up your weekly review. Block 15 minutes every Friday to update and review your numbers. Make it recurring.
- Establish baselines. Even if your numbers are bad, write them down. In three months you'll be glad you did.
- Create alert thresholds. What numbers would trigger concern: response rate below X, churn above Y?
Chapter Checklist
Before moving to Chapter 9, complete:
- Chosen your tracking tool (spreadsheet, Notion, Airtable, or CRM)
- Identified your data sources (CRM for deals, payment processor for revenue)
- Defined your pipeline stages with clear transition criteria
- Identified your OMTM (One Metric That Matters) for current stage
- Blocked 15 minutes weekly for metrics review
- Established baseline numbers for key metrics
- Set alert thresholds for concerning changes
Self-assessment questions:
- Can I name the 5-7 metrics that matter most to my business right now?
- Do I know which leading indicators predict my results?
- Am I reviewing weekly, or is my data sitting unused?
- Can I explain what my current numbers mean for my business health?
[1] Belkins, "What Are B2B Cold Email Response Rates? (2026 Study)," updated June 2026. https://belkins.io/blog/cold-email-response-rates. 7,530,489 cold emails sent in 2025; reply rate = unique replies divided by emails sent.
[2] Livespace, "Know Your Benchmark: B2B Sales Benchmarks Report for 17 Industries." https://www.livespace.io/en/blog/b2b-sales-benchmarks-report/. Data from over 1,200 small and midsize Livespace customers, 2022 to Q3 2024.
[3] First Page Sage, "The LTV to CAC Ratio Benchmark." https://firstpagesage.com/seo-blog/the-ltv-to-cac-ratio-benchmark/
[4] SaaS Capital, "2025 B2B SaaS Retention Benchmarks," research brief, September 2025. https://www.saas-capital.com/wp-content/uploads/2025/09/RB32WS1-2025-B2B-SaaS-Retention-Benchmarks.pdf. Median NRR 101% and GRR 91%; bootstrapped companies 104% NRR and 92% GRR.
[5] First Page Sage, "Average Customer Acquisition Cost (CAC) by Industry: B2B Edition." https://firstpagesage.com/reports/average-customer-acquisition-cost-cac-by-industry-b2b-edition-fc/. Client data January 2022-August 2025; B2B SaaS $205 organic, $341 inorganic, $239 combined; Fintech (SaaS subcategory) $1,450.
[6] First Page Sage, "Sales Funnel Conversion Rate Benchmarks: 2026 Report." https://firstpagesage.com/seo-blog/sales-funnel-conversion-rate-benchmarks-report/. B2B SaaS: Lead to MQL 39%, MQL to SQL 38%, SQL to Opportunity 42%, Opportunity to Closed 37%.
[7] Semrush, "We Studied the Impact of AI Search on SEO Traffic. Here's What We Learned," June 2025. https://www.semrush.com/blog/ai-search-seo-traffic-study/
[8] Croll, A., and Yoskovitz, B., Lean Analytics: Use Data to Build a Better Startup Faster, O'Reilly, 2013.